The Active region AR13664 on the Sun, during its passage during the week of May 8 – 15, 2024, erupted several X-class and M-class flares, which were associated with Coronal Mass Ejections (CMEs) during May 8 and 9. These produced a major geomagnetic storm on May 11, 2024. Two of the remote sensing payloads on board Aditya-L1 (SoLEXS and HEL1OS) captured these events during May 8-9, 2024 while the two in-situ payloads (ASPEX and MAG) captured this event during May 10-11, 2024 during its passage through L1. These observations were subsequently reported by ISRO, along with the observations made by the Chandrayaan-2 spacecraft, XPoSat as well as by USO-PRL ground-based facility.
During those series of eruptive events, two remote sensing instruments onboard Aditya-L1, viz. the Solar Ultra Violet Imaging Telescope (SUIT) and the Visible Emission Line Coronagraph (VELC) were in baking and calibration modes respectively, and couldn’t observe the event during May 10- 11. Both SUIT and VELC doors were opened on May 14 after the completion of the indented operations.
Observations by these payloads (SUIT & VELC) are provided below:
SUIT observations
The Sun images acquired by the SUIT payload on May 17, 2024, are provided below.
")
Figure 1: Sun image in Mg II k line (NB3): NB3 shows the bright, active regions on the Solar disk. The active regions signify magnetically active regions on the Sun’s surface. Large solar flares may originate in these active regions due to changes in magnetic field. The Sun is moving towards solar maximum, giving rise to enhanced activity. So, there are several active regions visible around the equatorial region.
")
Figure 2: Sun image in Mg II h line (NB4): Similar to NB3, NB4 shows the bright active regions on the Solar disk. The active regions signify magnetically active regions on the Sun’s surface. Solar flares may originate in these active regions due to changes in magnetic fields. The Sun is moving towards solar maximum, giving rise to enhanced activity. So, there are several active regions visible around the equatorial region.
")
Figure 3: Sun image in Narrow Band 276 nm (NB2): The continuum emission shows the sunspots in the active regions. The plages around the active regions are also visible.
")
Figure 4: Sun image in Narrow Band 283 nm (NB5): The continuum emission shows the sunspots in the active regions. The plages around the active regions are also visible. The relative brightness of the sunspots are different from 276 nm narrow band. This variation appears as the different narrow bands probe different heights of the atmosphere, probing the structural difference of the magnetic tubes at different heights.
")
Figure 5: Sun image in Narrow Band 300 nm (NB6): The continuum emission shows the sunspots in the active regions. The plage region around the sunspots is also visible. The sunspots show umbra (dark sunspots) and penumbra (less dark region around the sunspot).
")
Figure 6: Sun image in Broad Band 320-360 nm (BB3): 320-360 nm broadband probes the UV continuum emission from the chromosphere, sampling a wide range of depth in the solar atmosphere. The sunspots on the disk and the limb are prominently visible.
A comparison of solar images taken by SUIT payload at different wavelength
| Solar Images | Wavelength | What It Observes | Why It’s Useful | Unique Science Areas |
|---|---|---|---|---|
| Figure 1 | Mg II k | A layer above the Sun’s surface called the chromosphere | Helps study solar flares and energy distribution; | Studies how the solar flares heat up the chromosphere and how the energy is deposited |
| Figure 2 | Mg II h | Same as Mg II k, in the chromosphere | Similar to Mg II k; Studies solar flares and energy; | Also studies how the solar flares heat up the chromosphere and how the energy is deposited. Combined with Mg II k provides measurement for density of the local plasma |
| Figure 3 | Narrow Band 276 nm | Chromosphere, Blue wing of the Mg II valley | Focuses on solar flares, sunspots, and energy transfer; Useful for space weather understanding/ predictions | Effect of solar flares deeper in the Chromosphere. Combined with Mg II k provides information about long term solar activity variations. |
| Figure 4 | Narrow Band 283 nm | Chromosphere, Red wing of the Mg II valley | Similar to 276 nm; Studies solar flares, sunspots, and energy deposition and transport; | Similar to 276 nm but Effect of solar flares deeper in the Chromosphere. |
| Figure 5 | Narrow Band 300 nm | Upper photosphere and lower chromosphere | Examines energy transfer deeper into the solar atmosphere | Helps understand how energy moves and heats different solar layers |
| Figure 6 | Broad Band 320-360 nm (centered at 340 nm) | Chromospheric and Photospheric UV continuum | Monitors solar activity and UV radiation over a wide wavelength range; Helps study long term solar variations | Studies the Sun’s overall UV impact and long-term solar behavior |
VELC Observations
VELC also carried out observations in one of the spectroscopic channels for the emission line 5303 Angstrom. Raster scans of the solar corona were carried out on May 14, 2024, to capture the coronal activities in this particular spectral line. The raster scan image at this wavelength is shown in Figure 7. AR 13664 location is marked in this raster image as a box. The raster image is created by assembling the wavelength-averaged slit images as the Sun is rastered on the slit of the spectrograph. The duration of the raster is about 20 minutes and used four slits covering different regions of the solar corona simultaneously. The yellow ‘open’ circle in the image indicates the edge of the solar photosphere (i.e. the ‘visible’ disk of the Sun). The black ‘filled’ circle indicates the extent of the occulting disk used in the VELC to block the bright light of the solar photosphere so that the relatively million times faint structures in the solar corona could be observed.
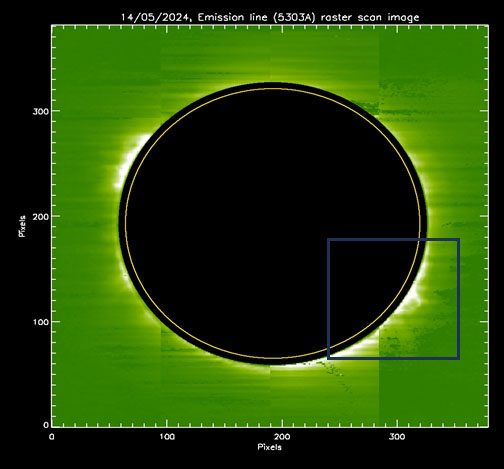
Figure-7: VELC observations made on May 14, 2024, at 5303 Angstrom. AR 13664 location is marked in this raster image as a box.
Source: https://www.isro.gov.in


Nurturing Creativity – Keekli Charitable Trust, Shimla